
Winning hearts and minds on X – where does each party stand in each province for the 2015 Canadian Election?
1. A quick look at the distribution of the seats between provinces and understanding the key battlegrounds
|
Ontario |
121 |
35.80% |
|
BC |
42 |
12.43% |
|
Alberta |
34 |
10.06% |
|
Quebec |
78 |
23.08% |
|
Manitoba |
14 |
4.14% |
|
Saskatchewan |
14 |
4.14% |
|
Nova Scotia |
11 |
3.25% |
|
New Brunswick |
10 |
2.96% |
|
Newfoundland |
7 |
2.07% |
|
PEI |
4 |
1.18% |
|
Territories |
3 |
0.89% |
|
House of Commons |
338 |
Source: wikipedia
- The provinces of Ontario, BC, Alberta and Quebec, represent a total of 81% of the seats in the House.
- The prairie provinces represent 8.3% of the seats
- The maritime provinces represent 9.5% of the seats
- The territories do not have political parties and are governed under the consensus government system
2. Defining the population of Canadians who are politically active on X
We defined the population of interest as the total number of Canadians who at least follow one of the major political candidates
| Population of Canadians who follow the 4 main canadidates | |
| Canada | 1030924 |
| Ontario | 431893 |
| BC | 125151 |
| Alberta | 117039 |
| Quebec | 119955 |
| Manitoba | 27396 |
| Saskatchewan | 23917 |
| Nova Scotia | 33184 |
| New Brunswick | 17926 |
| Newfoundland | 11640 |
| PEI | 5206 |
| Territories | 3464 |
Source: Fedica
3. A closer look at the fight to win over voters on X in each key provinces
Interactive maps of Candidates’ individual followers data: (toggle between country, province and city level)
Thomas Mulcair | Justin Trudeau | Stephen Harper | Elizabeth May
|
||||||||||||||||||||||||||||||||||||||||||||||||||||||||||||||||||||||||||||||||||||||||||||||||||||||||||||||||||||||||||||||||||||||||||||||||||||||||||
Source: Fedica
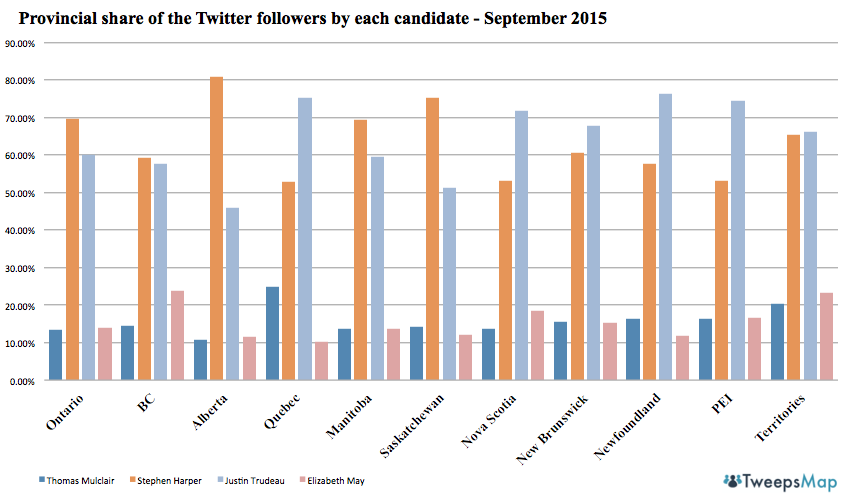
Ontario: Harper leading by a large margin; Green Party slightly ahead of NDP
Stephen Harper leads by a significant margin of 9% ahead of Justin Trudeau in 2nd place. Notably, the Green Party candidate Elizabeth May (14.05%) is ahead of the NDP (13.43%) by a slight margin
British Columbia: Conservatives lead by a small margin
Stephen Harper leads by a small margin ahead of Justin Trudeau
Alberta, Manitoba: Conservatives hold tight to stronghold
Little surprise here as Stephen Harper almost doubles the share of followers of Justin Trudeau in Alberta
In Manitoba, the lead is smaller for Harper (69.4%) vs 59.45% for the Liberals
Quebec: Liberals ahead by wide margin
Justin Trudeau (75.2%) is ahead of the 2nd place Stephen Harper by a wide margin (52.77%)
Maritime provinces: Liberals ahead in all provinces
The liberals have a lead in share in each single one of the maritime provinces by a sizeable margin
Weekly change shows NDP, Liberals gaining grounds on Conservatives in key provinces in September
Ontario: NDP gaining followers ~3 times as fast as Conservatives; Liberals gaining followers 76% faster than Conservatives
BC, Alberta: NDP gaining followers ~2 times as fast as Conservatives; Liberals gaining followers 38% faster than Conservatives
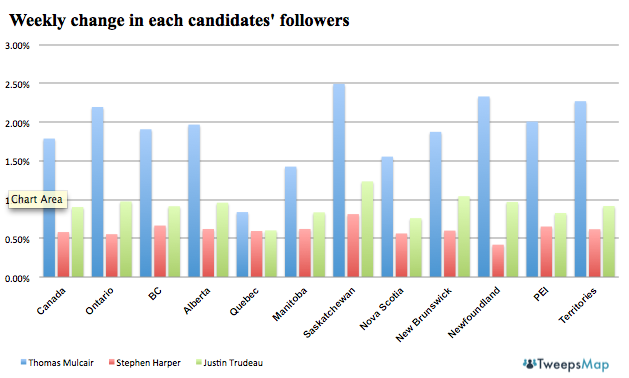
| Weekly change % – September 2 – September 9th | |||
| Thomas Mulcair | Stephen Harper | Justin Trudeau | |
| From Canada | 1.79% | 0.58% | 0.90% |
| Ontario | 2.19% | 0.55% | 0.98% |
| BC | 1.91% | 0.66% | 0.91% |
| Alberta | 1.97% | 0.62% | 0.96% |
| Quebec | 0.84% | 0.59% | 0.60% |
| Manitoba | 1.43% | 0.62% | 0.83% |
| Saskatchewan | 2.49% | 0.81% | 1.23% |
| Nova Scotia | 1.55% | 0.56% | 0.76% |
| New Brunswick | 1.87% | 0.60% | 1.04% |
| Newfoundland | 2.33% | 0.42% | 0.97% |
| PEI | 2.01% | 0.65% | 0.83% |
| Territories | 2.27% | 0.62% | 0.92% |
NDP Weekly Change
| ThomasMulcair | NDP | ||
| Week of | 2015-09-02 | 2015-09-09 | Weekly growth% |
| Canada | 150135 | 152818 | 1.79% |
| Ontario | 58009 | 59282 | 2.19% |
| BC | 18194 | 18541 | 1.91% |
| Alberta | 12606 | 12854 | 1.97% |
| Quebec | 29698 | 29947 | 0.84% |
| Manitoba | 3719 | 3772 | 1.43% |
| Saskatchewan | 3409 | 3494 | 2.49% |
| Nova Scotia | 4569 | 4640 | 1.55% |
| New Brunswick | 2775 | 2827 | 1.87% |
| Newfoundland | 1888 | 1932 | 2.33% |
| PEI | 847 | 864 | 2.01% |
| Territories | 705 | 721 | 2.27% |
Conservatives Weekly Change
|
Conservatives |
|||
|
Week of |
2015-09-02 |
2015-09-09 |
Weekly growth% |
|
From Canada |
689992 |
693998 |
0.58% |
|
Ontario |
301203 |
302869 |
0.55% |
|
BC |
74076 |
74568 |
0.66% |
|
Alberta |
94517 |
95103 |
0.62% |
|
Quebec |
63300 |
63676 |
0.59% |
|
Manitoba |
19020 |
19138 |
0.62% |
|
Saskatchewan |
17975 |
18121 |
0.81% |
|
Nova Scotia |
17605 |
17704 |
0.56% |
|
New Brunswick |
10849 |
10914 |
0.60% |
|
Newfoundland |
6708 |
6736 |
0.42% |
|
PEI |
2762 |
2780 |
0.65% |
|
Territories |
2269 |
2283 |
0.62% |
Liberals Weekly Changes
|
Liberals |
|||
|
Week of |
2015-09-02 |
2015-09-09 |
Weekly growth% |
|
From Canada |
620825 |
626434 |
0.90% |
|
Ontario |
259230 |
261759 |
0.98% |
|
BC |
72234 |
72894 |
0.91% |
|
Alberta |
53674 |
54189 |
0.96% |
|
Quebec |
90217 |
90760 |
0.60% |
|
Manitoba |
16288 |
16424 |
0.83% |
|
Saskatchewan |
12234 |
12385 |
1.23% |
|
Nova Scotia |
23809 |
23990 |
0.76% |
|
New Brunswick |
12173 |
12300 |
1.04% |
|
Newfoundland |
8871 |
8957 |
0.97% |
|
PEI |
3872 |
3904 |
0.83% |
|
Territories |
2291 |
2312 |
0.92% |